Is Central Jersey Real?
For many years, the question of the existence of a "Central Jersey"
has been a subject of much contention among Garden State residents.
As a non-native New Jerseyan who's never eaten "pork roll"
or "taylor ham", I wouldn't dare feign the hubris to settle
this debate -- but I can certainly share some data.
The analysis below uses data on dialects, demographics, occupations, income, education, and NFL loyalties. Using a statistical model, I test for the existence of a third, central region.
The question is not necessarily whether a clear and distinct cultural identity uniquely defines a Central Jersey. Rather, it may be better to ask whether the boundary between the North and South is fuzzy enough and large enough that there could be a Jersey that is neither too New York nor too Philadelphia -- but perhaps.. just right?
I'll start with some of the underlying data, then show the model's predictions. For a more detailed walkthrough of the pipeline, including exploratory analysis and documentation, visit the github page here. A good place to kick off the debate would be Wawas or Dunkin? Pork Roll or Taylor Ham? Eagles or Giants/Jets?
WAWAs
Per 100,000 residents
Dunkins
Per 100,000 residents
NFL: GIANTS/JETS FANS
As a percentage of Giants, Jets, Eagles fans (NJ.com poll)
PORK ROLL
Percentage of people who say Pork Roll instead of Taylor Ham (NJ.com poll)
Next, we look at dialects... do you say "calm" with the "l" or
"cahm"? Do you say "forward" with the "r" or is it "fohwud"?
Do you put clothes in a "draw" or a "drawer"?
(Thanks to Dale F. Coye of Thomas Edison State College for this data in his paper "Dialect Boundaries in New Jersey" (2009))
(Thanks to Dale F. Coye of Thomas Edison State College for this data in his paper "Dialect Boundaries in New Jersey" (2009))
"Calm" without the L
Percentage of the population that drops the "l" in "calm".
"Almond" without the L
Percentage of the population that drops the "l" in "almond".
"Forward" without the R
Percentage of the population that drops the "r" in "forward".
"Draw" not "Drawer"
Percentage of the population that says "drawer" instead of "draw".
"Gone" like "don" not "dawn"
Percentage of the population that says "gone" like "don" instead of "dawn".
And of course demographics: who are the people that live in these
regions? Were they born in the states? Are they Asian? Did they graduate
college?
FOREIGN BORN POPULATION
Percentage of the population that was born outside of the United States.
WHITE POPULATION
Percentage of the population that is White.
BLACK POPULATION
Percentage of the population that is black.
ASIAN POPULATION
Percentage of the population that is Asian.
COLLEGE EDUCATED
Percentage of the population with college degrees.
What industry do they work in? There are 18 industry categories
in Census data and all were included in the model.
Below are maps for just 4 of these:
Manufacturing
Percentage of the population that works in Manufacturing
Health Care and Social Assistance, Educational Services
Percentage of the population that works in Health Care and Social Assistance, Educational
Services
Wholesale Trade
Percentage of the population that works in Wholesale Trade
Service
Percentage of the population that works in Service
Using a few machine learning models, I trained each model using
the following as North Jersey: Bergen, Essex, Hudson,
Morris, Passaic, Sussex, and Warren. And used the following as
South Jersey: Atlantic, Burlington, Camden, Cape May,
Gloucester, and Salem. For each of these counties, the Census
tracts were given the labels "North" or "South". Then, I asked
the model to make predictions on all Census tracts. The results
are plotted below.
Logistic Regression Prediction
Map colors indicate probability that the Census tract
should be classified as "North".
Radial SVM Prediction
Map colors indicate pr("North"); C=1, gamma=2
KNN Prediction
Map colors indicate pr("North"); k=3
Random Forest Prediction
Map colors indicate pr("North");
max_depth=3, max_leaf_nodes=3
AdaBoost Prediction
Map colors indicate pr("North")
The barplot below shows the features that were used in the
logistic regression model on the y-axis and coefficients on the
x-axis. The red bars indicate variables that suggest a tract belongs to South Jersey
and blue bars indicate variables that suggest a tract belongs
to the North.
Finally, a plot of the first two Principal Components shows a
pretty clear gap between North and South:
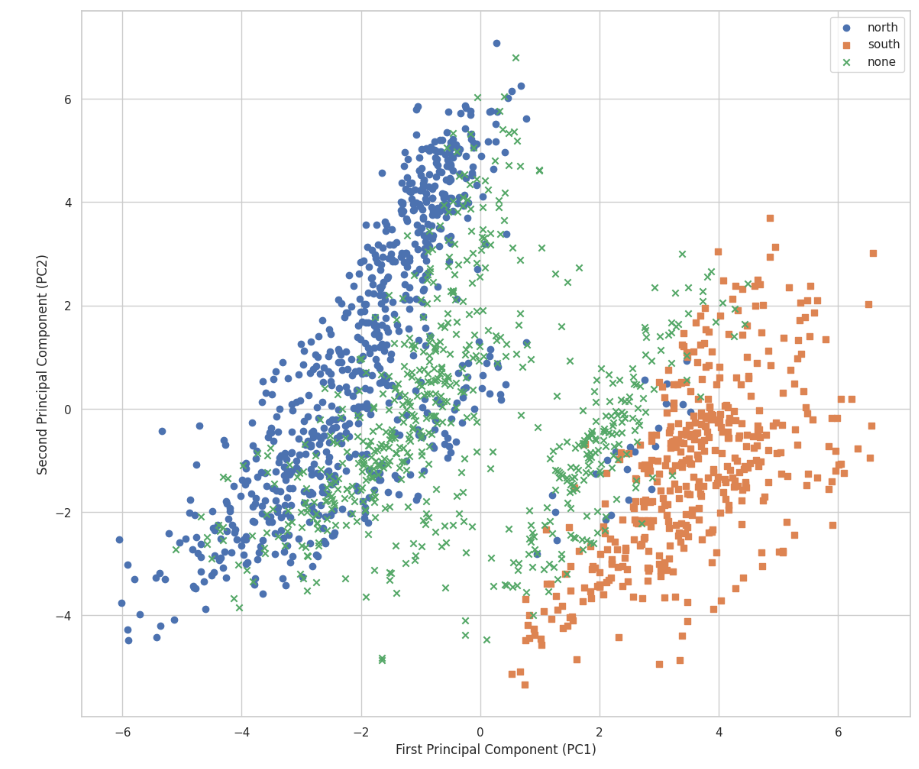
It does appear that in several models, there is a clear region
that is neither not North enough nor South enough. But is the
strip of light blue to light orange stretching from Hunterdon
to Ocean substantial enough to be an independent entity?
And in some of the models, there is a thin boundary and no
suggestion of a Central Jersey whatsoever.
And so after all that, I'm not sure. But perhaps this itself could be a takeaway -- even with a data-driven analysis, the existence of a Central Jersey continues to be an enigma.
And so after all that, I'm not sure. But perhaps this itself could be a takeaway -- even with a data-driven analysis, the existence of a Central Jersey continues to be an enigma.